Monitor & Debug
Once an agent is live, this is your loop for keeping it healthy.
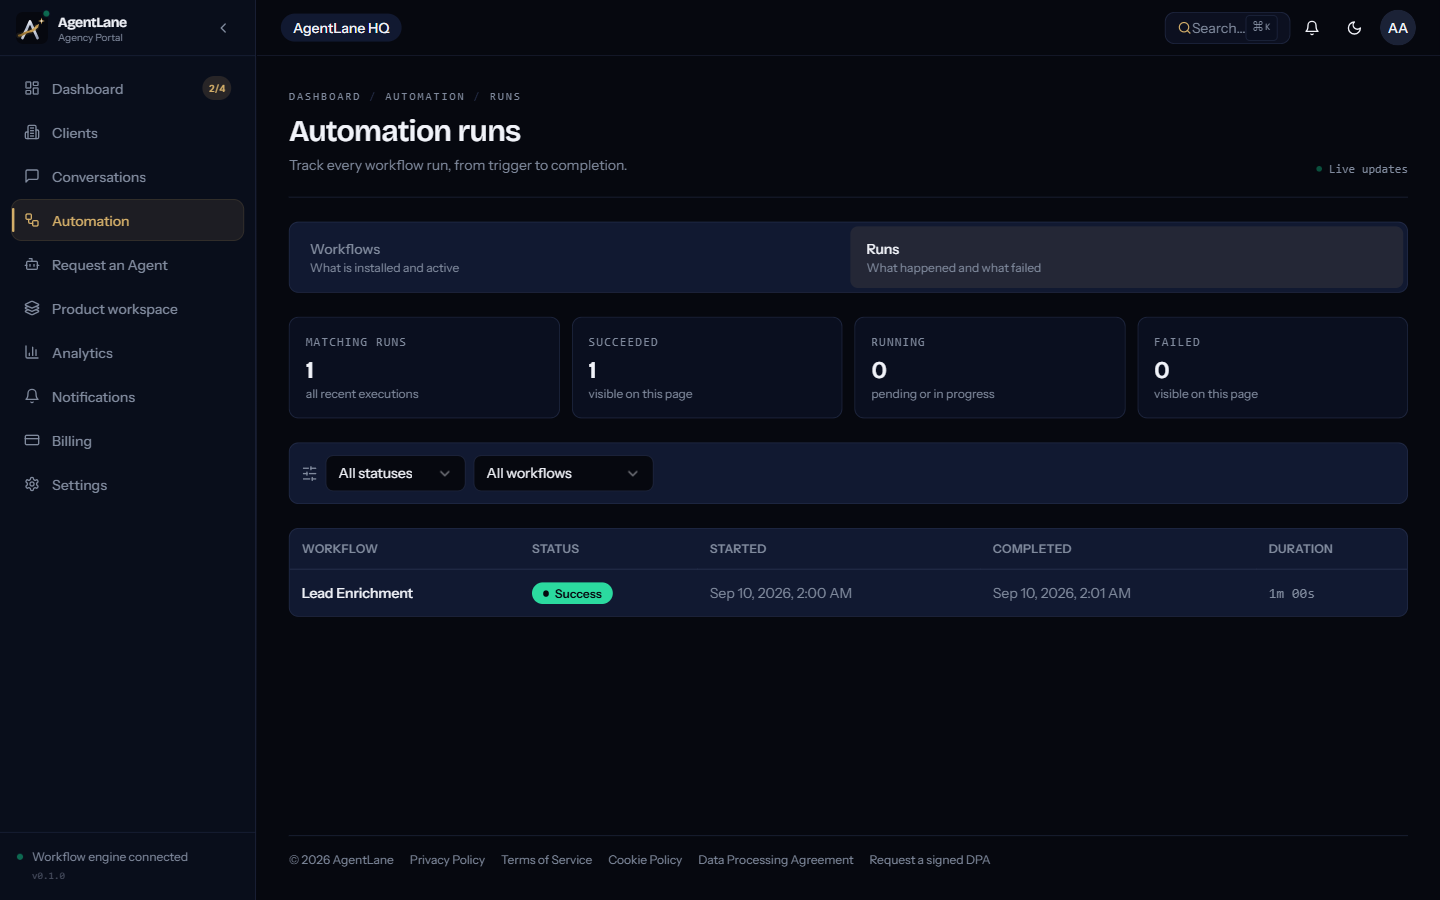
Watch the Executions feed
/dashboard/executions is a real-time, cross-client feed of every workflow run, with a live connection indicator (green pulse = live updates; otherwise “reconnecting”). Filter by status (Pending/Running/Success/Failed) and by workflow, and expand any row to see the execution ID (copyable) and its raw output payload.
Check Workflow instance health
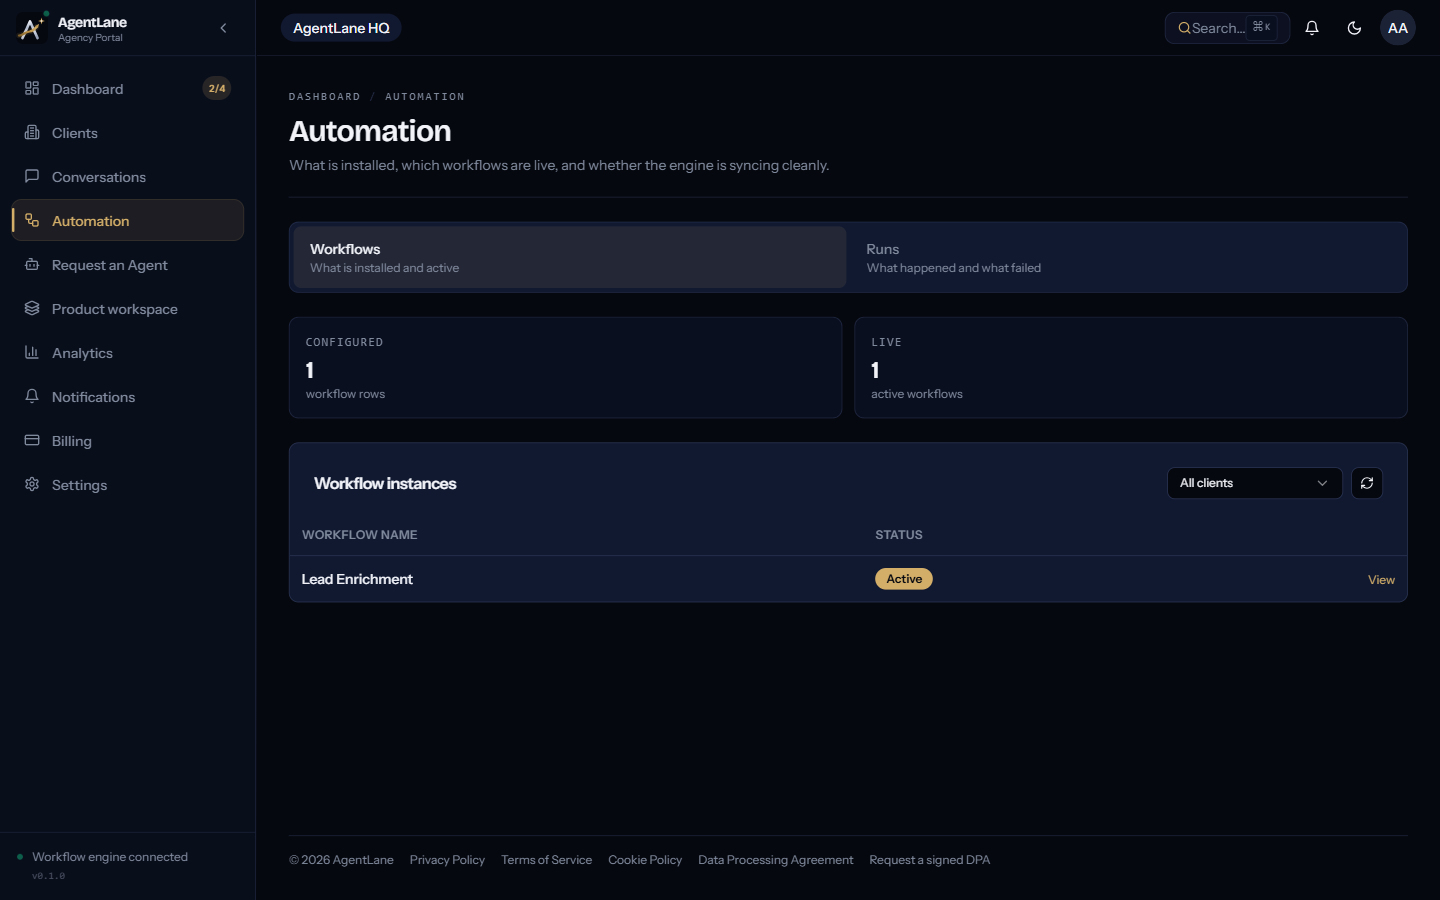
/dashboard/workflows lists every provisioned workflow instance across your clients, filterable
by client. The Workflow instance card shows overall Activepieces connectivity
(Healthy/Unreachable) and the configured endpoint — click Re-check health to run the check on
demand rather than waiting for the next automatic poll.
Review business-impact numbers in Analytics
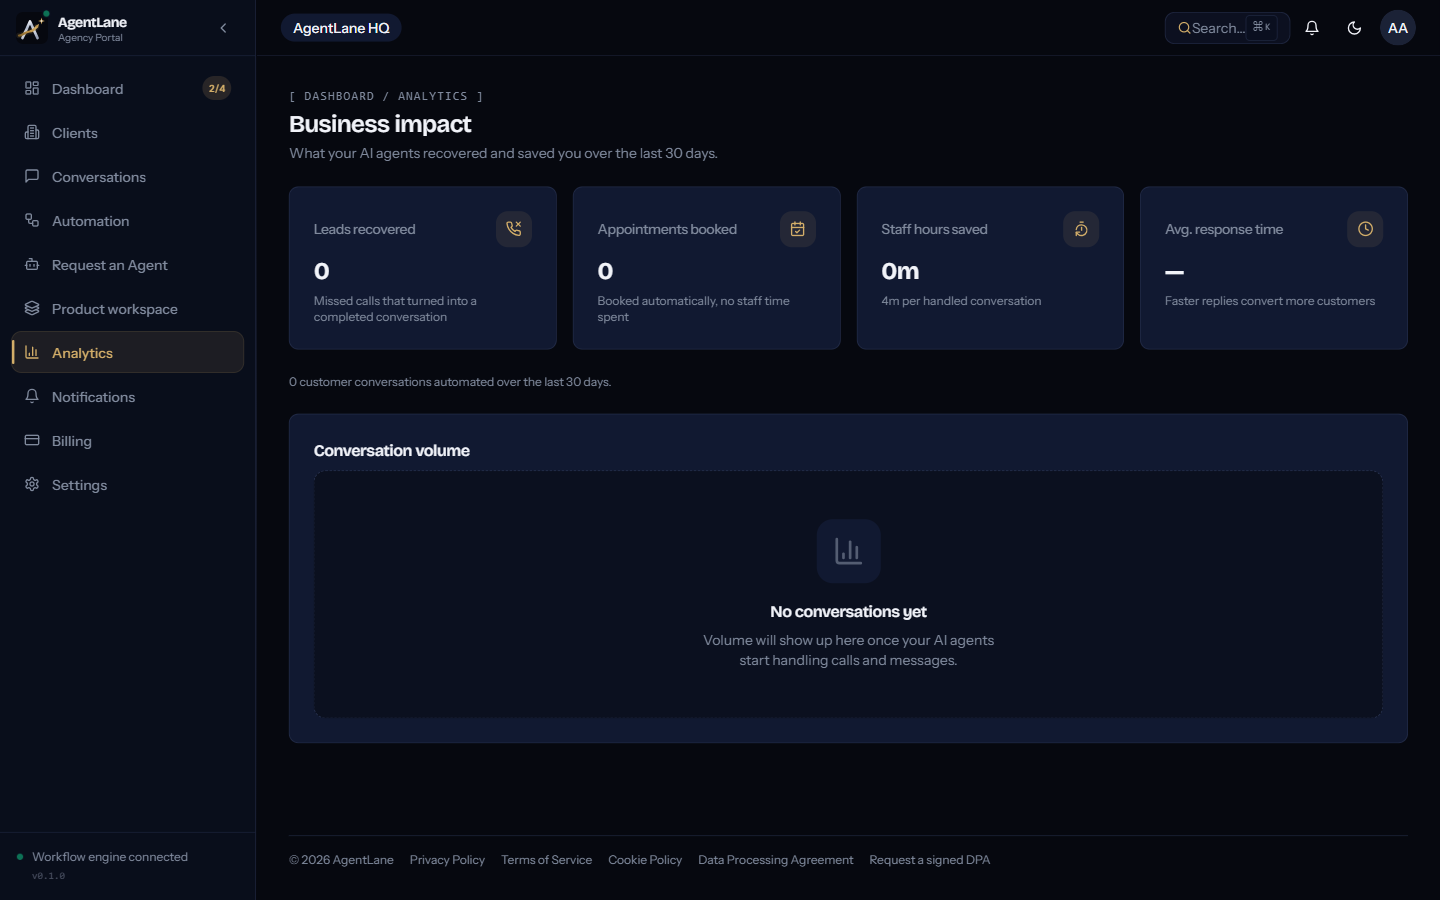
/dashboard/analytics turns the last 30 days of conversations into numbers your clients actually care about: leads recovered from missed calls, appointments booked automatically, staff hours saved, and average response time, plus a stacked area chart of completed vs. failed conversation volume per day.
When something’s wrong
- A specific run failed — find it in Executions, expand it, and read the raw output payload for the actual error.
- The workflow instance itself is unreachable — see Workflow Engine for what “unreachable” means and how to escalate.
- An agent is live but nothing is executing — see Troubleshooting for the credential and webhook-delivery checks to run first.